---
Title: Graph Paper Lindenmeyer Systems
Status: published
Date: 2025-11-02
Category: dev
Tags: [personal, technical, writeup, design-patterns]
promo_image: preview.png
---
[](./preview.png)
When I was a kid I learned about [Lindenmeyer Systems](https://lsystem.club) and the fun tree patterns they create. I even followed a [Twitter bot](https://x.com/LSystemBot/status/1283072526747238400) that generated and posted random pretty lsystem renders.
These are similar to fractals, except unlike traditional fractals they don't usually expand within a fixed space, they either continue to grow or loop back intersecting themselves.
Meanwhile I spent most of my time in school and needed something to occupy my hands with. I did a lot of notebook doodling, except people *notice* those.
But I did have graph paper. And graph paper gives you enough structure to draw lsystems by hand. So I did, a lot.
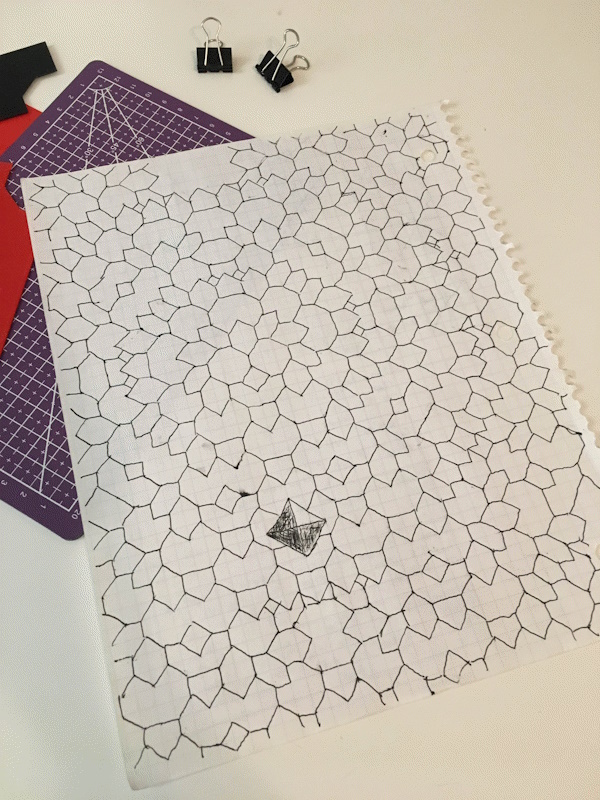{: .size-m}
I probably went through a notebook every two years, and I can't remember once ever drawing an actual graph.
This was when I was a child in childish ways and hadn't yet learned about dot paper. Oh, misspent youth....
There are a couple interesting things about this mathematically.
First, there's only really one interesting space-filling pattern to draw on graph paper, which is forking off in two 45 degree angles. Anything that doesn't fit on the coordinate grid (like incrementally decreasing line lengths) becomes irregular very quickly.
The main option to play with different patterns is by setting different starting conditions.
(Seems like it'd get boring quick, right? I spent the rest of the time trying to apply the [Four color theorem](https://en.wikipedia.org/wiki/Four_color_theorem) in an aesthetically satisfying way. Still haven't solved that one.)
Second, drawing on a coordinate grid means using [Chebyshev Geometry](https://en.wikipedia.org/wiki/Chebyshev_distance), where straight lines and diagonal lines are considered the same length. So a circle (points equally far apart from a center point) is a square. This is also sometimes called chessboard geometry, because it's how pieces move on a grid.
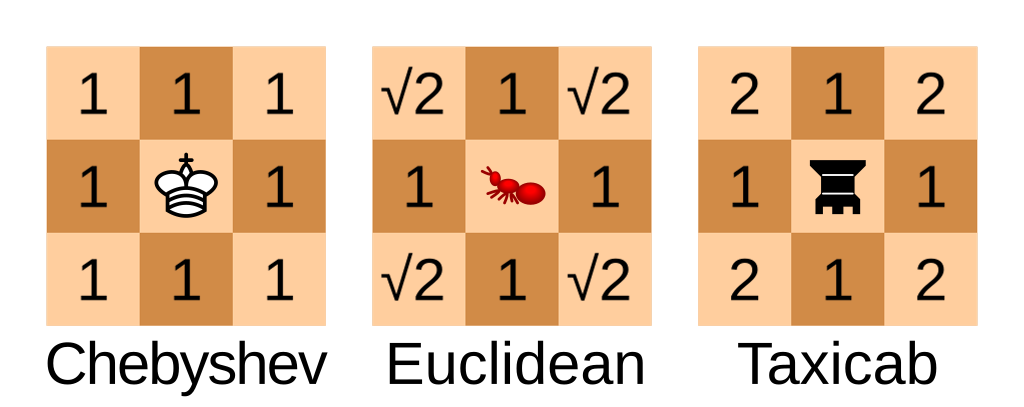{. size-m}[^wcred]
[^wcred]: Illustration by Cmglee - Own work, CC BY-SA 4.0, Link
Also, because I'm drawing this by hand, I can only keep track of visible tips. So if tips collide I count them as "resolved", even if mathmatically they'd pass through each other.
But I kept hitting the end of the graph paper.
I was bored in a work meeting this week and ended up doing the same thing, and it made me wonder about the properties of the pattern. Did it repeat? Did it reach points of symmetry? I thought it would be fun to whip up a tool to run my by-hand algorithm to see.
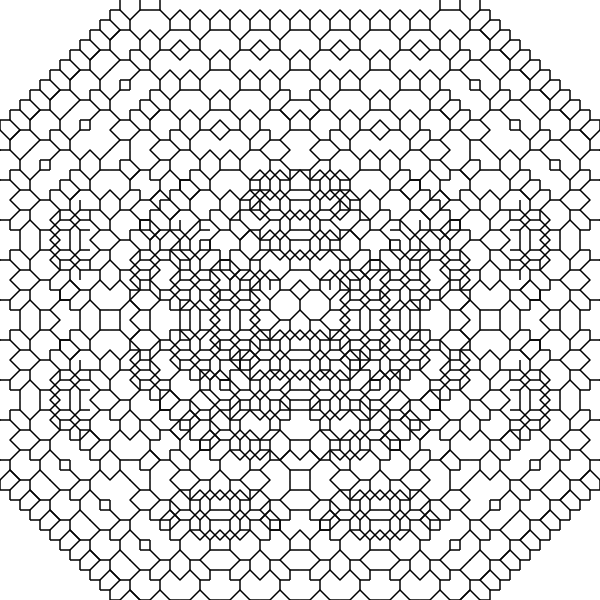
There are lots of web toys for lsystems but none are designed with these graph paper constraints. So just as an exercise I built my own from scratch, and it's pretty good at drawing my high-school pattern.
{: .size-m}
The answer to the pattern question is: it depends on the starting position! If you start with one line you start to see radial symmetry, but if you start with two lines facing away from each other (as in the animation) it's more interesting. Neat.
Each generation is considered a state frame that keeps track of `lines` (for rendering), `buds` (for growing the next iteration), `bloomed_buds` (for bud collision) and `squares` (for line collision).
For the Chebyshev geometry I just keep every line at a 1.0 length and let the trigonometry functions round up.
I didn't actually implement a parser for formal Lindenmeyer syntax, I just defined everything recursively in pure Javascript, using a `definition` to encapsulate details about the pattern:
```js
const definition = {
at(bud) {
const lines = []
const buds = []
for (let angle of [
bud.r - 0.25,
bud.r + 0.25
]
) {
const rads = Math.PI*angle
let len = 1
let xy = [bud.x + len*Math.sin(rads), bud.y + len*Math.cos(rads)]
if (chebyshev) xy = xy.map(Math.round)
lines.push(xy)
buds.push({x: xy[0], y: xy[1], r: angle})
}
return {lines, buds}
}
}
```
Then rendering is done recursively:
```js
function get_frame(generation) {
if (generation < 0) throw Error(`Invalid generation ${generation}`)
if (!frames[generation]) {
const frame = structuredClone(get_frame(generation - 1))
const old_buds = [...frame.buds]
const new_buds = []
const new_squares = []
for (const i in old_buds) {
...
}
frame.bloomed_buds = [...frame.bloomed_buds, ...old_buds]
frame.squares = [...frame.squares, ...new_squares]
frame.buds = prune_buds(new_buds, frame.bloomed_buds)
frames[generation] = frame
}
return frames[generation]
}
```
There's a slight complication to doing this cheaply with lines: on paper, there are cases where lines intersect, and in those cases I stop at walls, even if it means drawing a partial line. Doing that kind of collision detection here in vector space would be very complicated! And without it the pattern loops back on itself and doesn't look as good, and definitely doesn't match my notebooks:
{: .size-s}
The solution for this was very simple collision detection. The final program keeps tracks of which squares are "occupied" and breaks branches any time they'd collide.
[I uploaded it to my stash](https://stash.giovanh.com/toys/lsys.html) if you want to play with it. As an added constraint I wrote everything by hand in one single-file html page.
The one problem with the tool (besides being bare-bones) is it renders the output as an SVG instead of a bitmap on a canvas. This "feels right": they're lines, might as well make them vectors. But on high values browsers have performance issues rendering [very large quantities of DOM elements](https://x.com/giovan_h/status/1985054800891793705).
I'd rewrite the renderer to draw to a canvas instead except I like the idea of the infinite SVG canvas specifically. The point was to escape the edges of the graph paper, remember?
But I'd already abstracted line drawing so the line coordinates were stored in state frames, so it was easy to write an alternate renderer using the canvas API.
## Related Reading
::: container related-reading
- [lsystem.club](https://lsystem.club)
- [Terrific Toothpick Patterns - Numberphile](https://www.youtube.com/watch?v=_UtCli1SgjI)